I have a General Investment account with Interactive Investor, but I found it very painful to calculate my UK Capital Gains Tax liability on my Stocks and Shares sales.
Then someone on the ii forum suggested I try www.cgtcalculator.com and it seems to be pretty good. It seems to understand the same day rule, Section 104 rule and the 30-day rule.
If you don't know what the 30-day rule (bed-and-breakfast rule) is, then watch this video (see example 1) and here. Note selling shares of ABC on Trading 212 for instance, but then buying ABC a few days later on Interactive Investor also counts in the 30-day rule (AFAIK)!
If you have several GIA accounts, you should combine all trades into one table (CSV, XLSX, etc.) first, before calculating gains/losses and CGT.
So here are my simple steps to calculate gains/losses for CGT purposes. I also include a Trading 212 example.
Use a PC/Notebook and the browser.
*NEW 2026: I have now written two conversion .exe/.python programs which will convert the .csv into a .txt file which can be loaded into cgtcalculator.com. One for Trading212 CSV files and one for Interactive Investor CSV files.
The latest versions can be found in my 28-Jan-2026 blog article. This saves you having to manipulate the data in Excel and the programs also do some checking of the data too.
STEP 1 - Download a CSV
Both Interactive Investor and Trading 212 allow you to download your shares transactions or orders.
In all cases we need to download all the Buys and Sells that were made from the very start of when you opened the account up to 30 days AFTER the last day that you want to include.
For instance, to calculate your CGT for the tax year 2023-2024:
Start date: Date you made your first trade (across all GIA accounts)
End date: 5 April 2024 + 30 days = approx. 5 May.
Interactive Investor
2. Login and go to Transaction History and make sure your Trading account is selected.
3. Set the period to 2 Years (this stupidly seems to be the maximum - if you started your GIA account more than 2 years ago, you will have to do several CSV downloads in periods of 2 years by setting Custom dates (really painful!) and then combine the CSVs). You must include all orders for any shares that you have sold in the tax year that you want to calculate CGT for. If you know you only sold ACME shares in 2024 and you only bought them in Feb. 2023, then you only need to go back as far as Feb. 2023. If you have made many purchases of ACME shares over a many years, then you must get a CSV that includes that first purchase. Tip: choose Save As.. and the vanilla .csv first option in the list - do not choose the MS-DOS or Macintosh .csv options).
You only need to include all trades of all shares that you actually sold in the relevant tax year. If you did not sell any ACME shares in the 2024/2025 tax year, then they don't need to be in the spreadsheet when working out 2024/2025 CGT (but it won't hurt if they are).
Note: cgtcalculator.com has a 'Convert' page which allows you to paste in an interactive investor (ii) downloaded .csv from Excel and it will then convert it to the correct format for the calculator. However, you must check the two right-hand columns carefully for erroneous values because it assumes the price of the shares is always in £ GBP but some US shares are actually priced in $USD. The ii .csv does always specifies the currency in £ even if the price is actually in $, so it is best to work out the share price by dividing the total cost by the number of shares (as in the Excel process described above). I have reported the issue to the developer.
Trading 212
Trading 212 actually provide a pretty good Tax Certificate document a month or so after the end of each tax year (around May/June I think). I am not sure if it caters for the 30 day rule but I suspect it does not. In contrast, the ii tax document just shows interest payments!
Just before the end of the tax year, I like to look at my total gains for the year because I have a £3000 tax free allowance on CG at the moment. I usually like to sell £20K of shares in my GIA and put it into my ISA at the start of the new tax year. This may crystallize a gain of over £3K (and thus tax is payable) and indeed, I may already have sold some shares and made some gains already. I try to take full advantage of the 3K allowance and a bed-and-ISA is perfectly OK to do (i.e. Sell ABC in my GIA and buy ABC in my ISA) with no 30-day window, etc. If my gains are under £3k then I don't need to declare it to HMRC.
1. Trading 212 - History - Orders (and select only the Orders checkbox). The date should be from the first day you opened the GIA account to 6th May 2025 (one month after the end of the tax year because if shares you bought up to 30 days after then end of the tax year will affect CGT calculations!).
2. Click the download folder/file icon to download a CSV file.
Note: T212 also limits the CSV download to a 12 month period for some insane reason. You may need to download previous years as well as the current year (because you may have purchased some shares in previous years). If you have used a GIA for 15 years, you will have to perform up to 15 separate downloads! So much for the 21st Century and computers!
STEP 2 - Excel manipulation
2.1 Delete unwanted columns
1. Load the .CSV file into Excel (or any spreadsheet app) and delete all the columns that we don't need.
The ones we want to keep are:
- Buy/Sell (if present)
- Date of
Settlement(correction - CGT uses Transaction Date not settlement date) - EPIC/Ticker name of share - e.g. SWDA (if this is not available, you can use the descriptive long name BUT it must not contain any spaces - you can use Excel's 'Find and Replace' to change all spaces to underscores)
- Number of shares
- Net Amount GBP (the amount you actually paid or received after including all costs and tax and foreign exchange fees, etc.) this must be in £GBP
 |
| Trading 212 with unwanted columns removed |
2.2 Manipulate/merge columns into one Buy\Sell column
 |
| Interactive Investor - add the Buy\Sell column A and combine Debit/Credit columns to make a single NET gain/cost column |
2.3 Add a 'Net price' column, etc.
Now we need to calculate the net share price in GBP by dividing the NET figure (which will have Stamp Duty, broker charges, Fx fees, etc. all costed in) by the number of shares.Once E2 has been entered, you can click on the cell and select the small black square at the bottom right of the cell and drag it all the way down to the bottom row of your spreadsheet.
Step 3 - CGTCALCULATOR.COM
Do NOT include the column headings.
NOTES
30-day rule examples
Example 1
 |
| Shares bought within 30 days are deemed to be of the same value. The SELL did not make a gain. |
Example 2
 | ||
| Effectively we bought at 13.3333 but sold at 25.00! |
Example 3
 |
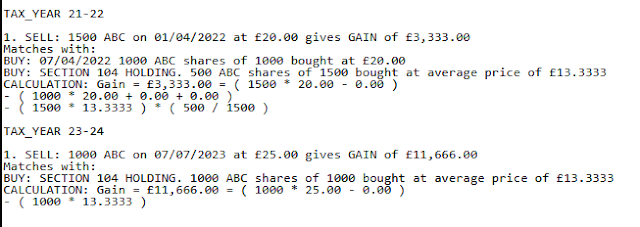
| Another example around the tax year end but selling 1500 and buying back only 1000. |
Example 4
 |
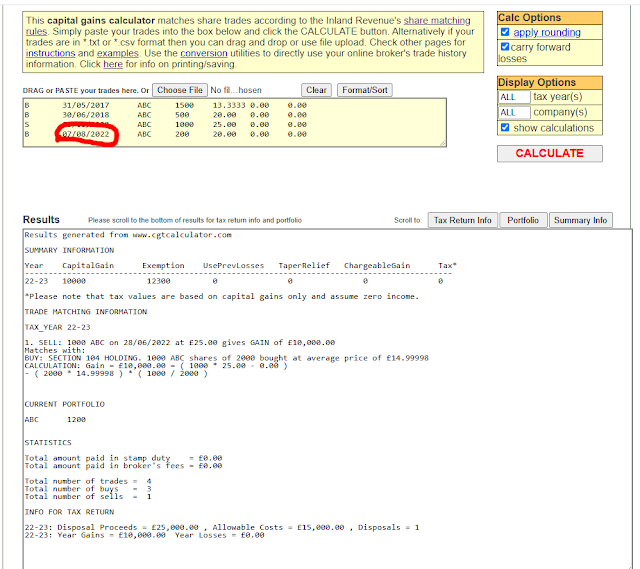
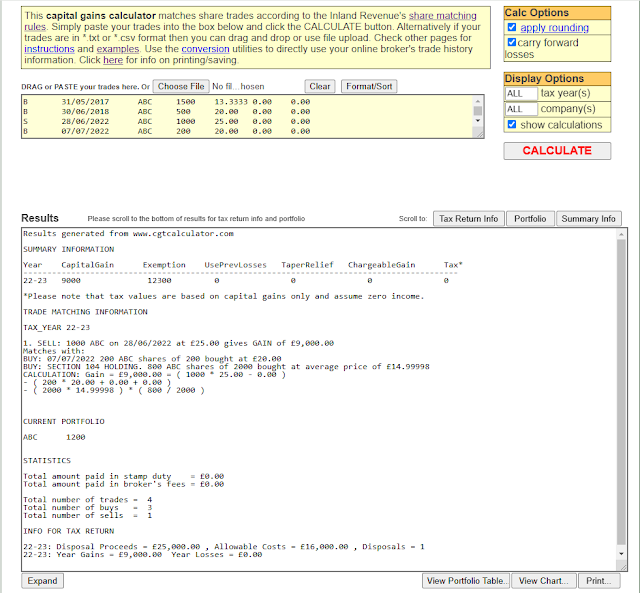
| Gain = £10000 |
So if the ABC share price has dropped since selling them for a gain, if you buy them back again within 30 days at a cheaper price, you can reduce your Gains for tax purposes on the previous sell substantially.


No comments:
Post a Comment