One of the best sites I have found is https://www.portfoliovisualizer.com
You can go to https://www.portfoliovisualizer.com/backtest-portfolio to build and back test several portfolios.
PortfolioVisualizer
The first thing to do is login and then select your Region (mine was UK for UK-based shares).
You can use the Settings tab in the Portfolio Model Configuration page (click on Customise Data) to set the period, etc. and the Portfolio Assets tab to define your shares and ratios for up to three bespoke portfolios...

 |
| Define up to 3 user portfolios |
You can then generate a report with lots of data and charts...

It allows you to do this using the free account.
It takes quite a bit of experimentation but it is great for comparing portfolios and mixes.
The above chart compares the performance of my ETF (Steve's mix) vs. some standard benchmark indexes.


A 50/50 mix of XLKQ+IUCM outperforms even the NASDAQ however!
Curvo.eu
For European investors, there is also https://curvo.eu/backtest/en which allows you to back test and compare different portfolios. It shows results from 2008 to June 2024 (max date at time of testing) by default and uses a lump sum investment of 10k but you can change the settings to a DCA type setup as shown below:

Here I test 50/50 AllWorld+NASDAQ, 50/50 USA Tech+Comms , 90/10 NASDAQ+AllWorld and 50/50 FTSE100+NASDAQ as a lump sum start.


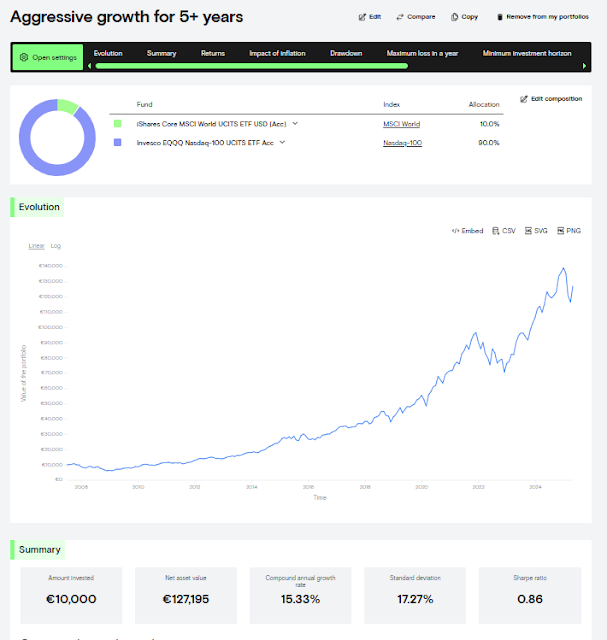

For a real portfolio, I would buy HMWS+EQGB and XLKQ+IUCM ETFs but the curvo back tester does not recognise some of these ETFs, so I have used their nearest equivalents.
The Sharpe ratio in trading is a metric that helps investors assess the risk-adjusted return of an investment or portfolio. It indicates how much extra return an investment provides for each unit of risk taken, relative to a risk-free investment. A higher Sharpe ratio suggests a more attractive risk-adjusted return, meaning the investment potentially offers better returns for the level of risk involved.
- Here's a more detailed explanation:
- What it measures:
- The Sharpe ratio quantifies the excess return (return above the risk-free rate) earned for each unit of volatility (standard deviation) in an investment's returns.
- How it's calculated:
- The formula is: (Portfolio Return - Risk-Free Rate) / Standard Deviation of the Portfolio's Returns.
- Risk-free rate:
- This is the theoretical return of an investment with zero risk, often represented by the return on a government bond.
- Standard deviation:
- This measures the dispersion or volatility of the investment's returns. A higher standard deviation indicates greater fluctuations in returns, meaning higher risk.
- Interpreting the ratio:
- A Sharpe ratio of 1 is generally considered acceptable, 2 is good, and 3 or higher is very good, according to IG UK.
- Use in trading:
- Traders use the Sharpe ratio to compare the risk-adjusted performance of different investment options, like stocks, ETFs, or mutual funds. It helps them choose investments that offer the best potential returns for the level of risk they are willing to take.
Here I compare Dollar Cost Averaging of two different mixes of EQQQ and SWDA...


 |
| 100% IITU for best growth but max date is only up to June 2024 |
Steve
My eBooks:


No comments:
Post a Comment